One of the most talked-about (and often confusing) social media metrics are reach and impressions. In this blog, we’ll show you how to measure reach and impressions with Determ and explain their significance.
Both metrics fall into the Reach KPIs for social media along with:
- Share of voice – the percentage of mentions you hold compared to your competitors (i.e. your relevance in the industry)
- Follower count – how many people follow your social media channels.
Since not everyone who follows you will see everything you post, these two metrics help you figure out whether your strategy is working or not. They tell you how many times your content was displayed to (unique) social media users. In fact, this is where the main difference between those two metrics lie.
- Reach tells you how many unique social media users saw your content
- Impressions tell you how many times your content was seen in general
Keep in mind that these two metrics don’t tell you how many people interacted with your content. To find that out you’ll need to look at engagement metrics such as clicks, likes, comments, and others.
Why Measure Reach and Impressions
Reach and impressions are metrics to look at when your focus is on improving brand awareness. But why do you need both metrics?
Well, while trying to boost your brand awareness you need to keep in mind that for users to notice your content, they need to see it more than once. Ever heard of “The Seven Time Factor”? Some marketers claim that it takes seven times for people to see the content for them to become aware of it.
To determine the average number of times users see your content, simply divide the total number of impressions with the total number of reach.
Sometimes, your content can start appearing in users’ feeds too often, which can lead to a counter effect called ad fatigue. That can lead to people opting to hide your posts or even unfollowing you. If you notice that the number of impressions is falling, you should consider changing things such as a featured image or a copy. That way users won’t keep seeing the same thing over and over again, and you might draw more attention with some fresh information.
Another thing to keep in mind is that the bigger the reach, the better the brand awareness. But, relying on this metric alone can be deceitful. Just because people are aware of your brand does not mean they’ll become a customer. That’s why it’s important to define who your target audience is, and create relevant content that will lead to a higher engagement and potentially higher conversion rate.
This is where you’ll add engagement KPIs into the mix.
Other Metrics to Monitor
Engagement KPIs such as clicks, likes, shares, comments and others will give you a better understanding of how your audience is interacting with your content. Creating relevant content plays an important role in customer engagement. Knowing your target audience well and providing them with content they’re interested in will help to boost their engagement.
Conversion KPIs such as conversion rate, click-through rate, cost per click, and bounce rate help you determine whether your social media strategy is successful in generating wanted actions from your target audience (purchases, newsletter signups, etc.)
Customer satisfaction KPIs such as online customer reviews show you how customers feel about your brand. Customer reviews are a great source of UGC which you can implement in your content strategy.
How to Measure Reach and Impressions with Determ?
When it comes to measuring reach on social media, Determ’s algorithm takes into consideration the number of followers on a page/ profile. Then it takes in calculation shares, comments, and likes – each having its value – from the posts (share being stronger than like since share means more people will potentially see and like a post on a different profile).
Here’s what you can measure reach and impressions for:
- Owned social media channels
- Social media competitor analysis
- Influencer reach
- Hashtag reach
Owned social media channels
With Determ, you don’t have to check stats on every social media platform individually. You can set up queries to track only your social media profiles and have all of the stats shown in your feed and reports.
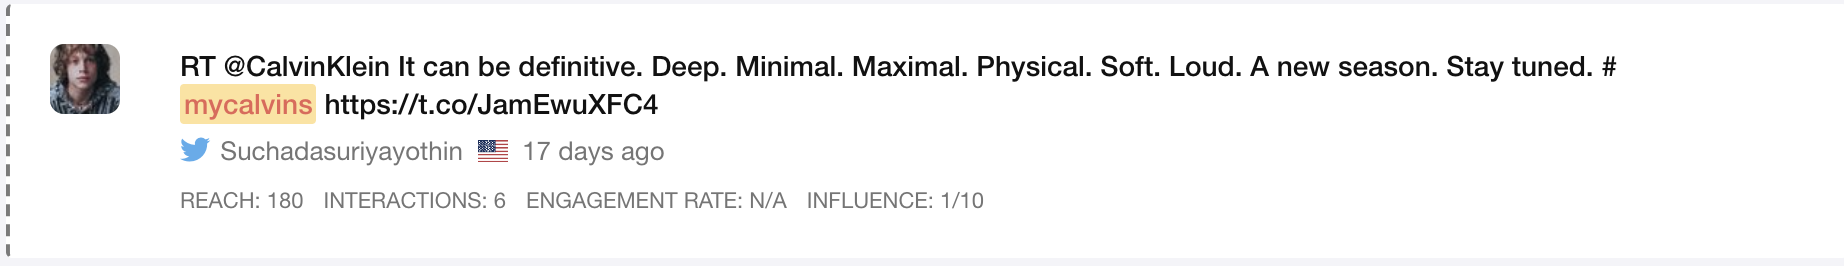
As you can see from the picture below, the reach metric is located under each mention in your feed, as well as interactions, engagement rate and influence.
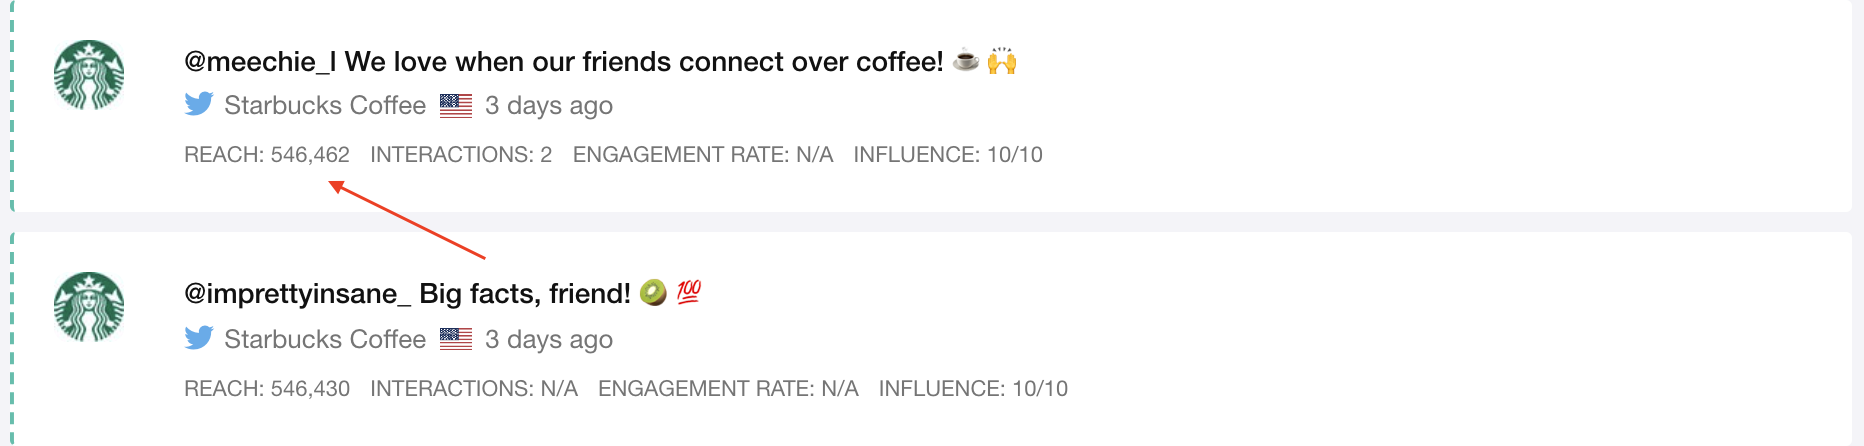
- Interactions indicate the number of people who liked, commented or shared the post.
- Engagement rate shows the percentage of people who interacted with the post after seeing it (likes, comments, shares). It is calculated by dividing Interactions with Reach.
- Influence score shows source influence ranked on a 1 to 10 scale. It indicates how influential that particular source is in comparison to every other source on the internet. An influence score of 1 means the source has a small audience. 10 is typically reserved for globally influential websites or social media profiles with millions of followers (for example, CNN website or social media accounts from Oprah or Elon Musk).
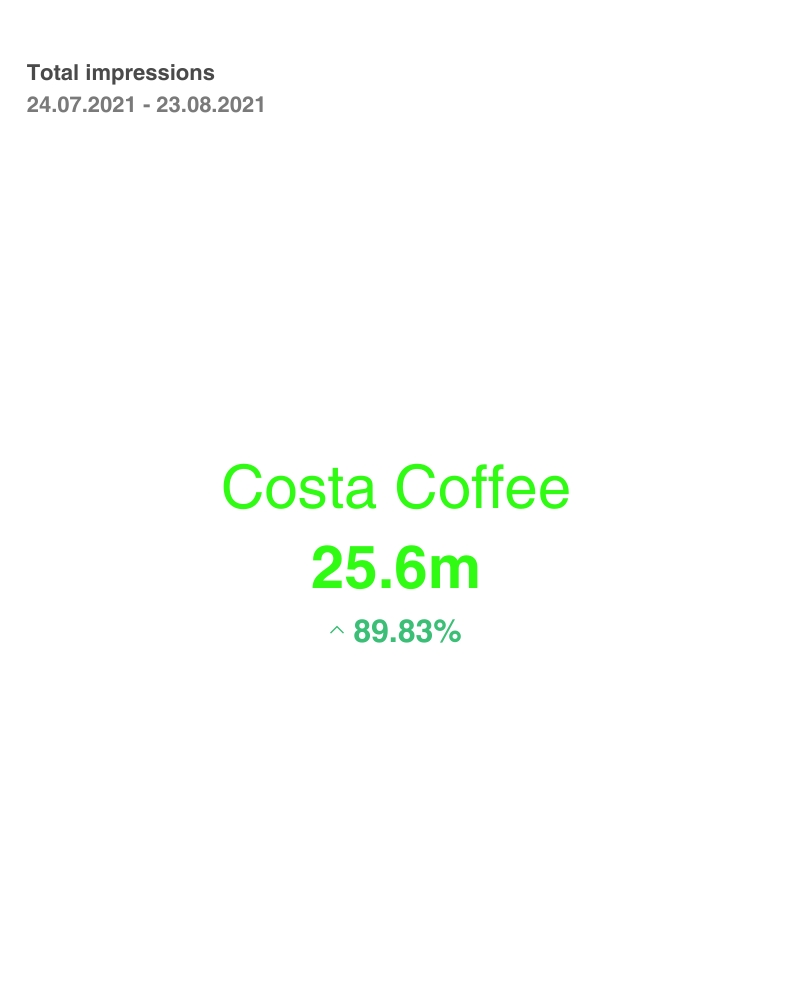
To find out more about your impressions, go to our reports.
The Total impressions chart shows the total number of impressions from your social media platforms. The percentage below shows the percentage of how much your impressions increased or decreased compared to the previous period.
The Share of impressions chart is available in the Competitive analysis report, where you can check the share of your impressions compared to your competitors.
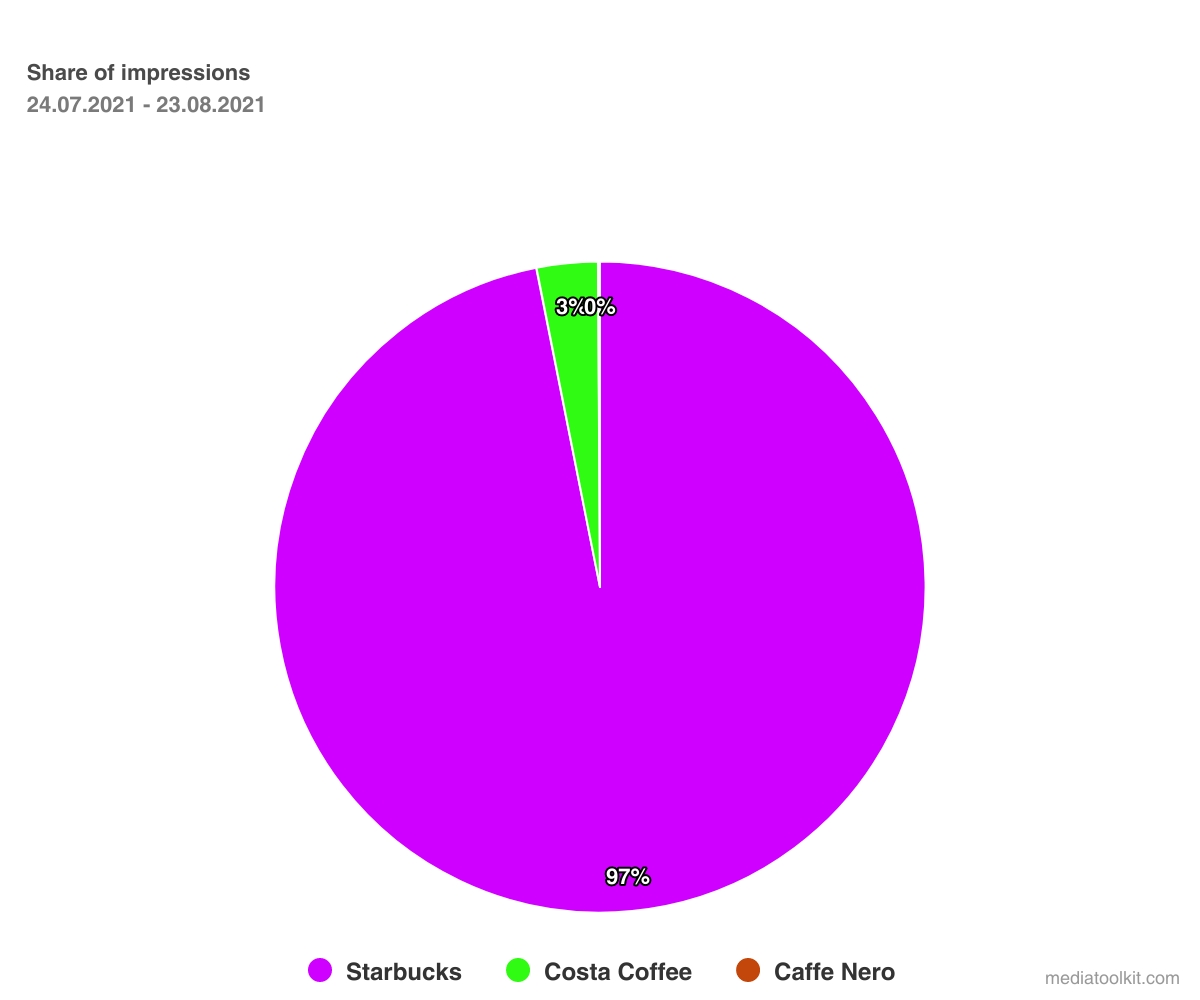
For example, the chart above shows Starbucks holding 97% of all impressions.
Social media competitor analysis
Besides monitoring your social media profiles, you can monitor your competitors’ profiles, as well.
In the competitor analysis report, you can find another useful chart for Reach KPIs – Share of voice.

This chart shows the ratio of reach among you and your competitors. You can also measure the reach of their influencers, hashtags, campaigns etc.
Suggested read: How to use Determ for Twitter Competitor Analysis?
Influencer reach
To measure the reach of your and competitors’ influencers, the best way to go is to create a custom report.
Additionally, you can create a comprehensive influencer report that will include information about your influencers and the ones from your competitors. With the custom report, you can discover top influencers by reach, number of mentions, and sort them by sentiment, source, language, location and so on.
Here are examples of useful two charts:
Top influencers by reach
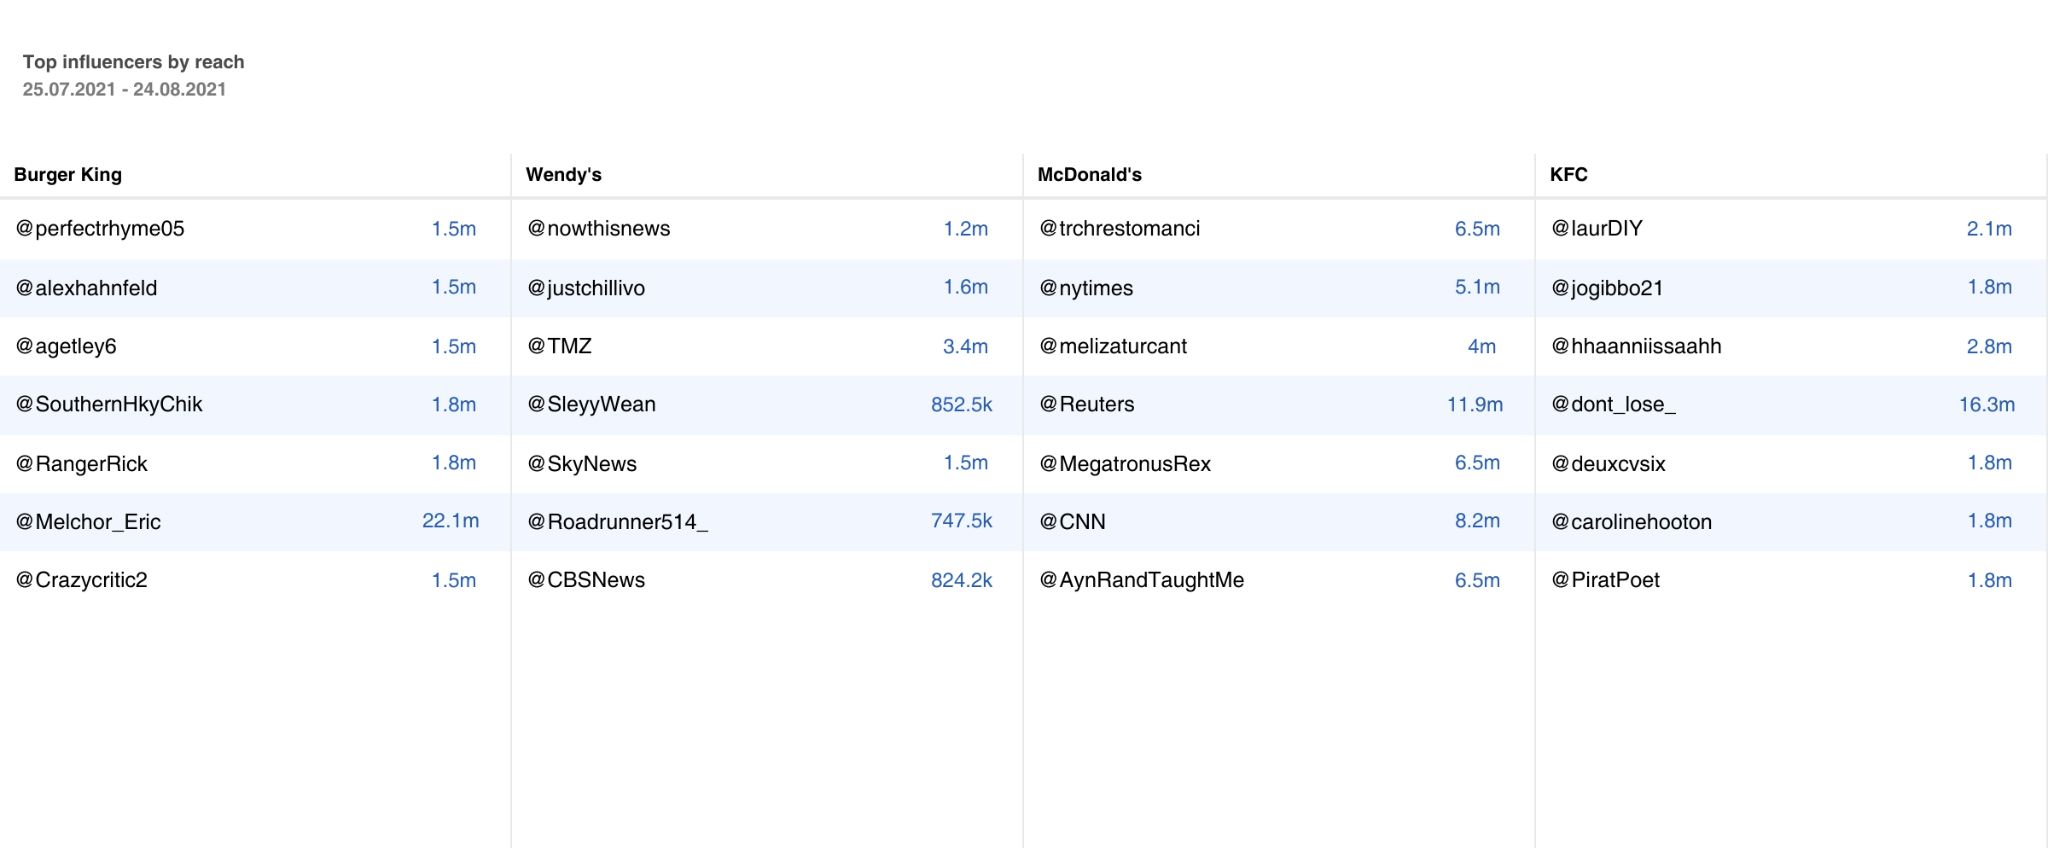
This chart shows influencers who are mentioning your brand and your competitors lined up based on the biggest reach. This chart is great for two things:
- Discovering who your biggest influencers are
- Discovering who your competitors’ biggest influencers are
This data opens doors for potential influencer collaborations. Also, you can identify what competitors’ influencers are saying about them and potentially win them over.
Top influencers by source
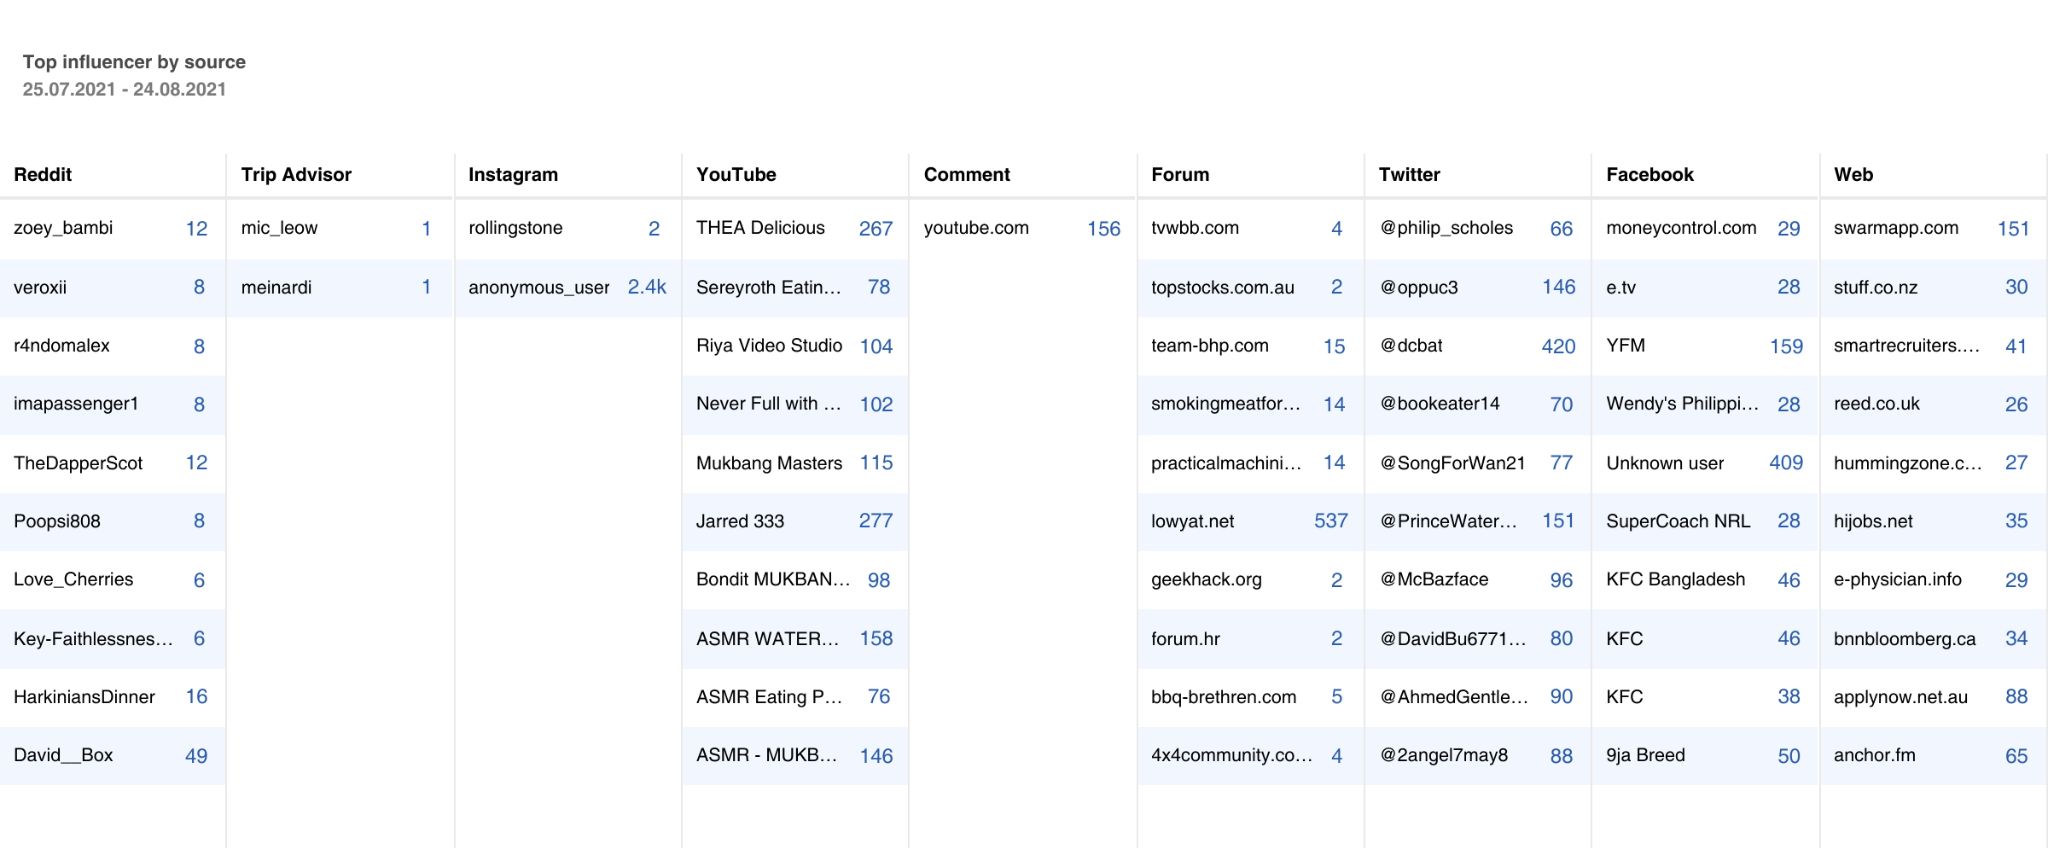
Your target audience is probably not active on all available platforms on the internet. If you’re struggling with reaching your target audience on a specific platform, you can take a look at this chart and find influencers that can help you expand your reach.
Top influencers by sentiment and reach

Just because influencers are mentioning your brand and have a big reach, it doesn’t necessarily mean that what they’re saying is positive. That’s why combining sentiment and reach as parameters is important. It provides you with context and can help you filter out influencers who are not the biggest fans of your brand. Also, by knowing who’s posting negative comments about your brand, you can reach out to them and figure out why they’re unhappy with your brand and resolve the situation.
Hashtag reach
Successful hashtags can help you improve your brand awareness, increase customer engagement, help you reach wider audiences, and much more. Monitoring your hashtag reach and impressions is important because it shows you whether your hashtags are getting noticed or not and how they’re performing over time.
For example, the impressions chart below indicates that the impressions for hashtag #mycalvins fell 90,51% compared to the previous period.

Nowadays, most campaigns and events have dedicated hashtags whose performance you can track before, during and after. If you notice your campaign or event hashtag is generating smaller reach and impressions than you’ve expected, that is a clear indication that you need to change something in your strategy.
After you’ve done some tweaks, you can monitor whether the metrics are improving or not.
Suggested read: How to start tracking hashtag performance?
To Sum Up
The best thing about using Determ for measuring reach and impression is that you have all data in one place. Whether you’re tracking your performance or the performance of your competitors, you’ll be able to find out everything with just a few clicks. Also, aside from reach and impressions, you can see other relevant metrics that will give you a comprehensive overview of your social media performance.
Start measuring your reach and impressions – book a call with one of our experts!